Pelycodus was a tree-dwelling
primate that looked
![]() much like a modern lemur.
The skull shown is probably 7.5 centimeters long.
much like a modern lemur.
The skull shown is probably 7.5 centimeters long.
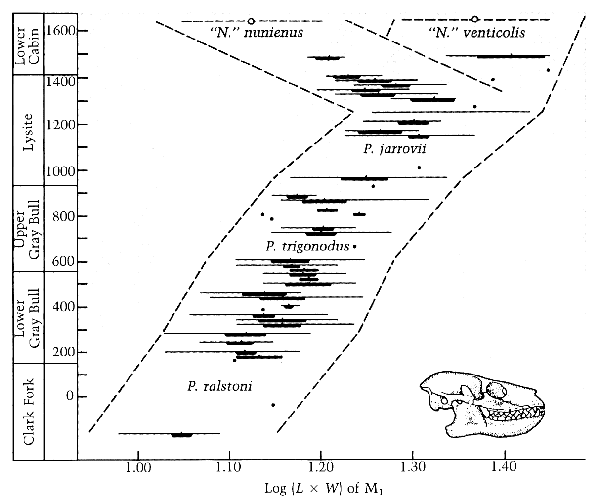
The numbers down the left hand side indicate the depth (in feet) at which each group of fossils was found. As is usual in geology, the diagram gives the data for the deepest (oldest) fossils at the bottom, and the upper (youngest) fossils at the top. The diagram covers about five million years.
The numbers across the bottom are a measure of body size. Each horizontal line shows the range of sizes that were found at that depth. The dark part of each line shows the average value, and the standard deviation around the average.
The dashed lines show the overall trend. The species at the bottom is Pelycodus ralstoni, but at the top we find two species, Notharctus nunienus and Notharctus venticolus. The two species later became even more distinct, and the descendants of nunienus are now labeled as genus Smilodectes instead of genus Notharctus.
As you look from bottom to top, you will see that each group has some overlap with what came before. There are no major breaks or sudden jumps. And the form of the creatures was changing steadily.
Pelycodus is from a group of creatures which collectively are thought to be the ancestors of modern monkeys and apes. The diagram represents the whole of the early Eocene, spanning very approximately 55 million years ago to 50 million years ago. The fossils are from sediment in the Bighorn Basin of Wyoming.
Since there are more data points leading to nunienus than to venticolus, it is most likely that a group of jarrovii became isolated from the main group, and later spread back - perhaps from the Bridger Basin, elsewhere in Wyoming. When two similar species compete, it is not uncommon that one fairly quickly becomes different - in this case, smaller. This presumably reduces the competition between the species.
The numbers at the bottom of the graph are computed values. Specifically, whenever a first lower molar tooth was found, its length and width were measured. The values plotted are the logarithm of the length times the width. The researcher reports reasonable evidence that this value correlates well with body size. He used this approach because there were a lot more teeth than anything else. (Teeth often fossilize.) By measuring just teeth, it was possible to have a lot more data points.
Each horizontal line shows the range, the mean, and the standard error of the mean. As you can see from the ranges, a larger sample would have been nice.
This is not a new result. Matthew noted in 1915 that these populations were evolving steadily, not only in size, but also in other characters not clearly correlated with size. The diagram is based on
Gingerich, P.D. 1976. Paleontology and phylogeny: Patterns of evolution at the species level in early Tertiary mammals, American Journal of Science 276:1-28.Gingerich has since extended this work, but the conclusion has not changed.